

It is news these days that a Lenovo manufacturing facility has introduced a production planning system based on AI and prescriptive analytics that has increased the facility’s order fulfilment rate by 20%, productivity by 18% and has reduced the production planning time from 6 hours to 90 seconds.
Spectacular at it may seem, this improvement is not exceptional but what you can expect in prescriptive analytics projects.
No project gets the green light without a prior analysis of its profitability. This analysis is all the more necessary when the context is more adverse and the more compromised the company’s situation.
In particular, advanced analytics projects (predictive and prescriptive, for example) should also have a good ROI forecast.
In order to have a good estimate of its profitability we need to pay attention to the expected result once the project is completed and, of course, to the cost of said project. Let’s start with the cost.
Cost
It is not possible to estimate a generic cost for a bespoke prescriptive analytics project. Its scope can vary largely depending on the case; in particular, depending on the mathematical complexity of the problem, the requirements for integration with other systems, the impact on the organization’s procedures, etc.
In any case, even in the most important ones, it is always possible to break down the scope into phases, where each phase offers results with immediate impact and that allows addressing the following with less risk. Each phase can be functionally aligned with your project priorities, giving an additional element of control compared to off-the-shelf solutions.
These phases can last from two to five months, a lot less than sophisticated information systems that require an extensive period of configuration and adjustment until it is ready to be used, and not always fully satisfactory.
In this way, the cost is contained within the execution of each phase which, in turn, offers measurable results in line with your priorities. Furthermore each phase serves as a validation gate before undertaking new phases and take full advantage of prescriptive analytics.
Returns
Now, how can we estimate the expected improvement that allows us to assess whether the cost of the project is justified?
Dr. Raúl Pulido carried out this analysis in his doctoral thesis entitled “Analysing the complexity of the model-based decision making processes within the industrial management context” in which he rigorously analysed the results of 56 real projects with proven impact.
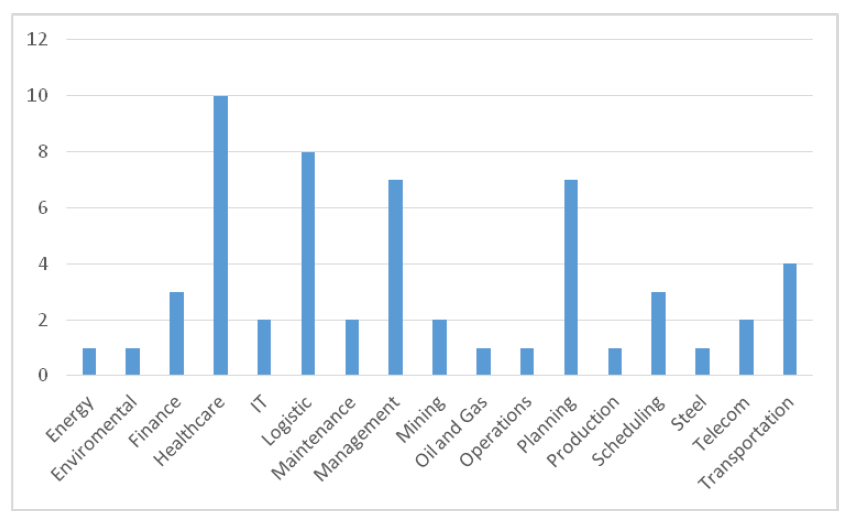
To find projects with hard evidence, Dr. Pulido reviewed 56 articles published in the Interfaces journal between 2013 and 2015. The mission of said journal (now International Journal on Applied Analytics) is to publish papers on the practices of organizations in different areas such as Operations, Systems Information, Strategy, Supply Chain Management, etc. It is important to note that one of the requirements for publication is a letter of verification from the company in which the work was carried out.
How is improvement measured?
The metric of improvement varied depending on the project. In some cases results were compared against the original plan, in others against the previous year or against forecasts. The magnitude also varied depending on the sector and the project: lives saved in the case of a health sector project, while in other sectors it was financial savings or time spent carrying out certain tasks.
In general, the average of reported savings was 15.95% with a standard deviation of 9.06, and values ranging between 3% and 37%.
Conclusion
If you are considering adopting prescriptive analytics to improve your processes, a rigorous study based on proven industry experience shows that you can expect a margin of improvement between 10% and 20%.