
One of the biggest problems for telecommunications operators is determining the quality of experience (QoE) of their television clients (IPTV).
Unlike quality of service (QoS), which measures performance through the values taken by certain predefined magnitudes such as speed, latency or jitter relative to acceptable value ranges, the QoE of a service is as good or as bad as the customer perceives it.
There are methods and algorithms based on the combination of surveys (for example Net Promoter Score – NPS) and QoS measurements through automatic tests that offer a generally accepted approximation for the operator. In this post we want to present a slightly different approach, less reliant on surveys, based on advanced analytics.
The challenge
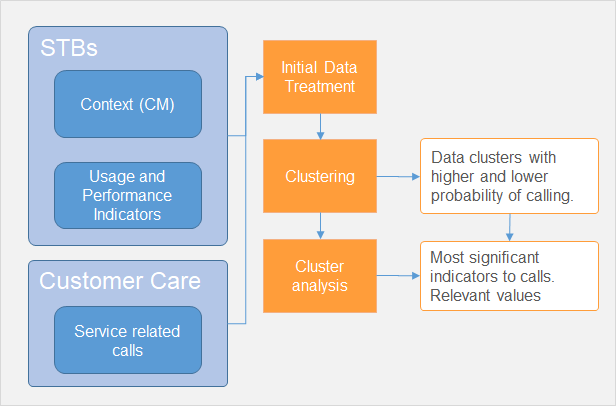
This approach responds to the need for a communications operator to assign a grade to their IPTV clients’ QoE. To that effect, they made available to us a set of data collected from hundreds of thousands of set top boxes (STBs) that contained:
- For each STB, more than 30 KPIs for both performance and IPTV use, aggregated daily, differentiating by type of service. Many of these KPIs consisted of error counts in different protocols and interfaces.
- Configuration parameters for each STB.
- The list of customer service (CS) calls related to the television service.
The approach
The approach we followed consisted in grouping STBs into clusters of similar usage patterns, configuration and performance, and then measuring the density of calls to CS in each one, which can be understood as a QoE grade in itself (an STB in a cluster with high call density is surely perceiving a worse quality of service than if it were in a different cluster with low call density).
Thanks to this analysis, the operator can decide which group of STBs with similar usage and configuration characteristics to lend more attention to. Note that the objective was not to predict whether a specific customer would call CS or not.
The main advantage of this method is that first, it aligns the definition of the QoE metric with the operator’s customer service process and, second, it adapts it by design to a measure of customer feedback on the quality with which the service is perceived, without the need to resort to surveys (although they can be incorporated if available), or statistical sampling, or periodic indicator adjustments.
Its main drawback is that the results are not comparable over time in the way we are traditionally used to, since it does not return a traditional QoS metric for each STB, but rather a categorization associated with the probability of a customer service call. This can be overcome by resorting to classic QoS metrics.
What did we find?
As in any other data project, in this one it was necessary to clean and resize the dataset in order to manipulate it. We had more than 70 variables that needed to be reduced. This same process is extremely interesting because it is equivalent to identifying which variables have an impact on the quality perceived by the user.
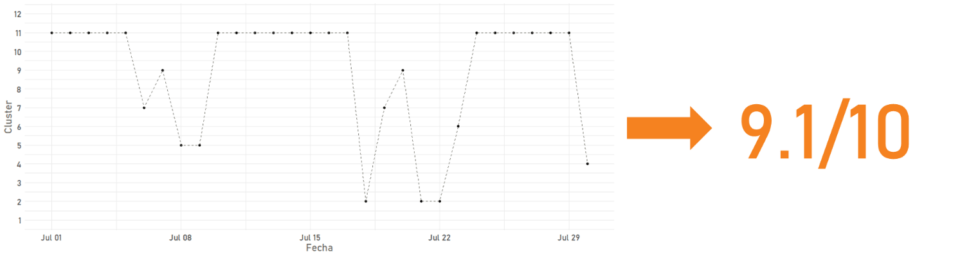
Another step worth highlighting is the estimation of the optimal number of clusters, for which different iterations had to be carried out. In this case it ranged between 8 and 15. It is worth noting that by factoring in configuration, usage and performance, the clusters comprised similar devices with KPI values that reflected similar incidents – very useful information for the engineer in charge of supervising the service.
Among these clusters we were able to find some with a CS call rate that varied between 30% and 700% of the whole sample. This distribution did not change much in the next iterations of the algorithm.
For each TV service, we differentiate between clusters with low and high call density. For one particular service, the high-density cluster, in which a specific error prevailed, presented 16,000 records and 2.15% of call density (around 340 in total), while the low-density cluster (good QoE) presented 0.12% of call density.
That is: this error caused 340 CS calls and 15,700 customers more noticed it and did not call.
In short, with this method we were able to link changes in KPIs and QoE, and quantify their impact in a systematic way in business terms (CS calls) and discover the silent majority of customers who, despite experiencing a quality of service that could be improved, will not call CS: in total, over 80,000.
What else can be done?
This project demonstrated how the ability of advanced analytics to find patterns in complex systems can be successfully applied in the telecommunications industry, but more can still be done to return more value.
For example, the model can be enriched with surveys (NPS) in such a way that the clustering does not only respond to CS calls but also to positive reactions such as an NPS 9 or 10, and also, consider for each client the clusters to which it has been assigned over time.
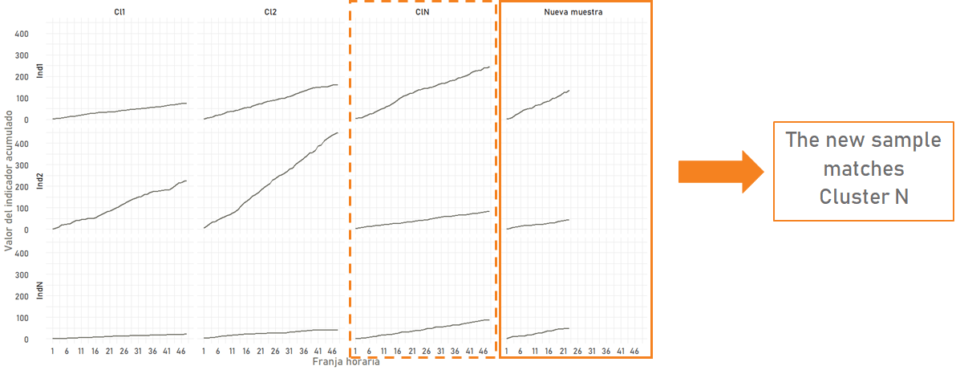
The model can also be adapted to assist service supervision tasks by incorporating intraday evolution of the indicators by cluster, in such a way that it can be detected early if an STB is going to be allocated to a particular cluster, which would allow proactive decision making.
If you are interested in knowing more about how to use advanced analytics to manage the QoE of your service, please contact us. We will be delighted to assist you.