

How Bayesian inference enables decisions with risk-adjusted metrics.
Let us start with a simplified example that allows us to isolate a common problem in business decision-making.
Imagine a purchasing committee that must award a six-month logistics contract for 15,000 shipments, with a minimum SLA of 97% on-time deliveries and penalties for non-compliance. In the final stage of the process, two operators are competing.
Supplier A has carried out an eight-week pilot in a specific region, handling 120 real shipments with 99.8% on-time performance and a cost 6% lower than its competitor.
Supplier B, for its part, demonstrates 98.1% on-time performance over 8,500 comparable shipments in the past year, including peak-demand periods, with low variability in delivery times and proven large-scale capacity.
At first glance, 99.8% appears superior to 98.1%. However, the real question lies not in the percentage, but in the statistical robustness that supports it.
The 120 pilot shipments provide a very positive signal, but with greater uncertainty about future performance when scaling volume and complexity. In contrast, the 8,500 historical shipments significantly reduce that uncertainty and allow for a more precise estimation of the probable performance range.
It is not about distrusting a good result, but about understanding that sample size determines the level of risk we assume when making a decision. Statistics do not eliminate uncertainty, but they allow us to quantify it. And when small percentage differences can translate into significant financial and reputational impact, that quantification ceases to be academic and becomes strategic.
As data volume grows and comparisons become more complex, intuition is no longer sufficient and the answer is no longer obvious. It is at that point that we need formal tools to distinguish signal from noise.

The mathematical answer: Bayesian inference
To rigorously mitigate this risk, it is necessary to go beyond basic statistics and apply Bayesian inference. In this approach, performance (for example, the on-time rate p) is not treated as a fixed value, but is modeled as a random variable.
For binary success-or-failure processes, such as on-time delivery compliance, we typically use a beta distribution. The iterative process is based on two key concepts:
- Prior: this is the starting point. It represents our “initial belief” before seeing any new data. It may reflect broad uncertainty or incorporate knowledge of the logistics market (for example, “we know that the industry average in national distribution for OTD is…”).
- Posterior: this is the update of that belief after observing the provider’s real data. Bayesian mathematics combines the prior with the observed evidence to generate a new adjusted probability distribution.
In practical terms, the prior represents what we know before measuring; the posterior, what we know after incorporating evidence.
In the case of Supplier A (119 successes out of 120), the resulting distribution remains relatively wide. Although its mean is very high, the variance reflects that actual performance could decline when scaling volume, regions, and operational complexity.
In the case of Supplier B (approximately 8,339 successes out of 8,500), the distribution concentrates into a much narrower peak around 98%, offering minimal variance and greater confidence in the figure.
The winning strategy is to rank the options not by their mean (E[p]), but by the lower bound of their credibility interval (for example, at 95%). Mathematically, we seek the value x such that P(p > x) = 0.95. In other words, we guarantee with 95% probability that the actual performance is at least that value. In this way, the model automatically penalizes the more limited information available from Supplier A, adjusting its score for dispersion, while recognizing the statistical robustness of Supplier B. The result is a risk-adjusted ranking, not just one based on the average.
From theory to operational reality
The scientific literature on Bayesian inference is extensive, but business reality introduces additional nuances. In logistics, for example, performance may not be stationary: seasonal campaigns, route changes, or demand fluctuations can alter the underlying behavior. There is also often a need for hierarchical priors that integrate information by region, product type, or distribution channel.
Due to this complexity, it is unlikely that a standard tool will automatically resolve the specific casuistry of each company. The model used to evaluate carriers cannot be directly transferred to fraud detection or clinical trial analysis without deep adaptation.
To address this gap with mathematical rigor, models must be tailored to each context:
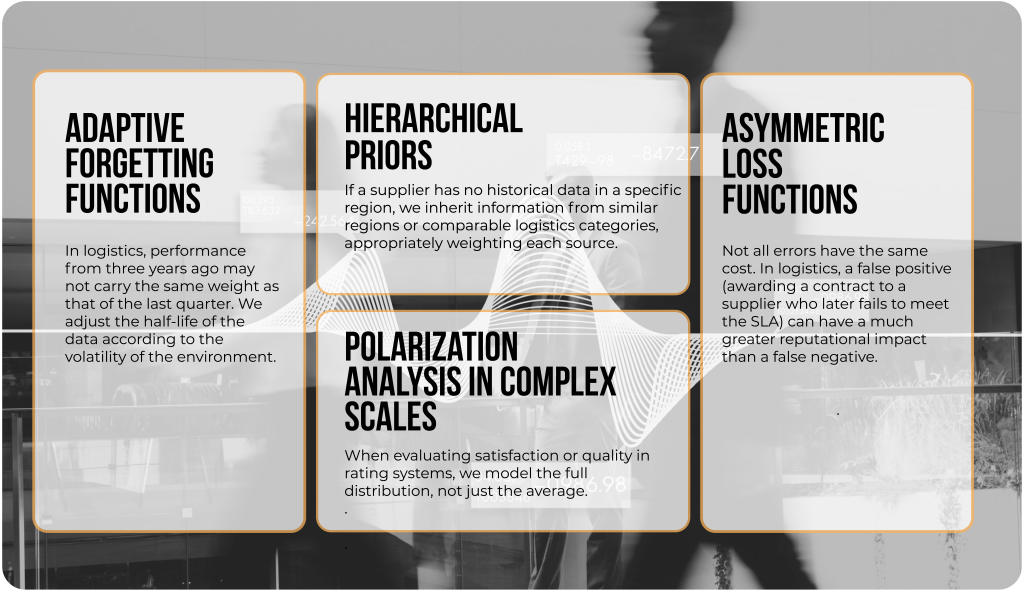
- Adaptive forgetting functions: in logistics, performance from three years ago may not carry the same weight as that of the last quarter. We adjust the half-life of the data according to the volatility of the environment.
- Hierarchical priors: if a supplier has no historical data in a specific region, we inherit information from similar regions or comparable logistics categories, appropriately weighting each source.
- Polarization analysis in complex scales: when evaluating satisfaction or quality in rating systems, we model the full distribution, not just the average.
- Asymmetric loss functions: not all errors have the same cost. In logistics, a false positive (awarding a contract to a supplier who later fails to meet the SLA) can have a much greater reputational impact than a false negative.
Impact on Industry
This approach transforms decision-making by shifting the focus from the isolated result to the statistical robustness that supports it.
- In logistics, for example, it is not just about comparing on-time rates, but about estimating the real probability of maintaining that performance as volume increases, route complexity grows, or seasonal pressure rises. This makes it possible to select operators not based on their single best figure, but on their structural reliability and operational resilience.
- In the energy sector, explicitly integrating weather uncertainty into forecasting models improves risk management in trading and supply planning. A renewable generation forecast with low variance is not the same as one with high dispersion: probabilistic adjustment allows for optimized hedging and reduced exposure to extreme scenarios.
- In banking, this framework helps differentiate between consolidated fraud patterns and atypical but natural behaviors in newly created accounts. By modeling the uncertainty associated with limited history, false positives that affect customer experience are reduced without weakening protection against real risks.
- In marketing, it prevents over-allocation of budget to segments showing 100% conversion rates based on few cases. Incorporating sample size and variance makes it possible to prioritize opportunities with a higher probability of scaling sustainably, improving risk-adjusted return.
- Finally, in pharmaceutical R&D, this approach acts as a filter in early stages: a compound with promising preliminary results but based on small samples may require additional evidence before advancing to costly phases. In this way, statistics does not hinder innovation, but rather rationalizes investment by balancing potential and certainty.

In all these sectors, the common denominator is the same: turning uncertainty into a quantifiable variable enables more consistent, comparable decisions aligned with each organization’s risk tolerance.
An abundance of data does not guarantee strategic clarity. KPIs based solely on point estimates can conceal the risk associated with sample size and variance. The true qualitative leap does not lie in having more information, but in explicitly incorporating uncertainty into the decision model itself.
Designing this type of model requires adapting the mathematics to the specific operational context: scale, data quality, environmental volatility, and the differential cost of each type of error. There are no universal formulas that can be applied without adjustment. Competitive advantage arises when modeling reflects business reality rather than merely a statistical abstraction.


