

Before making any decision about a renewable energy plant, someone has to trust a piece of data: how much sunlight there is, how strongly the wind is blowing, or how much energy is being produced. That data comes from sensors installed at the site itself, continuously recording resource conditions and the performance of the installation.
The problem arises when those measurements stop reflecting reality accurately. Sensors can record incorrect or anomalous readings due to technical failures, interference, or certain weather conditions. When these errors go unnoticed and become part of the historical record, they also affect the analyses and decisions that depend on that information.
In previous articles, we explained how artificial intelligence can help anticipate failures and optimize maintenance in energy infrastructure, both in wind installations and hydropower infrastructure. However, there is a prior condition for these types of models to deliver reliable results: the information they use must also be of sufficient quality.
What happens when a sensor records incorrect data
Many decisions involving a renewable energy installation rely on historical information. In wind energy, for example, accurately understanding variables such as wind speed, direction, or turbulence is relevant when assessing site conditions and reducing uncertainty in investment and operational decisions.
When anomalies appear in these time series, the problem extends beyond a single incorrect reading. That information may later be used in energy analyses or as an input for other models, meaning that the quality of the historical record also affects the quality of subsequent results.
Having a large volume of data does not, by itself, guarantee reliable analysis. What matters is being able to identify which measurements accurately reflect observed behavior and which contain anomalies that should be detected and corrected before being used.
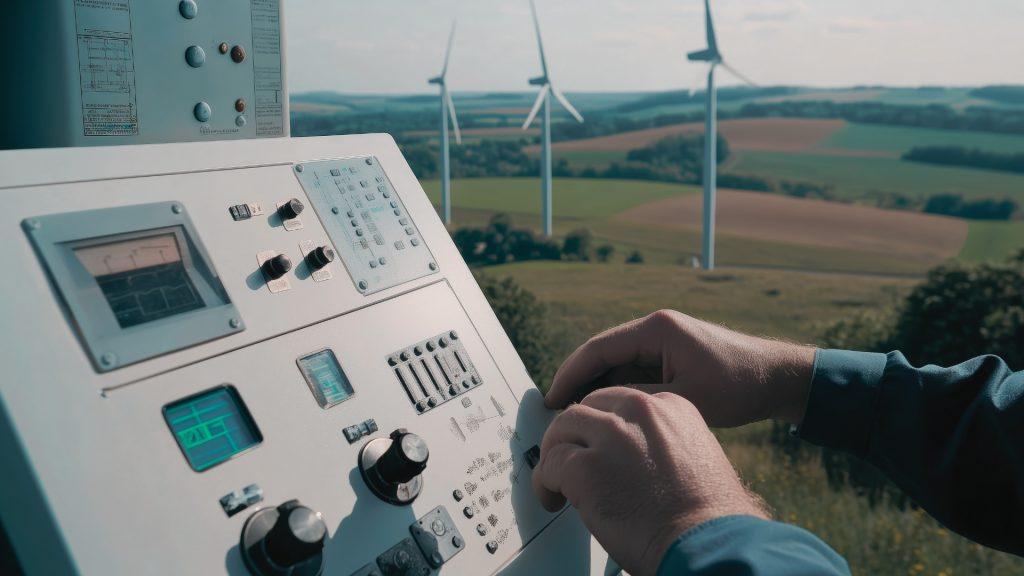
Why detecting an anomaly is not always straightforward
Some incorrect readings may be obvious, while others remain embedded within long time series and are more difficult to identify through conventional review.
The difficulty increases because an unusual observation is not necessarily incorrect. In variables such as wind, significant changes can occur as part of the resource’s actual behavior. Analysis therefore cannot be limited to identifying maximum or minimum values or records that fall outside a predefined threshold.
The challenge is to analyze the behavior of the series and identify patterns that are anomalous within the available dataset. As the volume of data or number of locations increases, performing this work exclusively through manual review requires progressively more time and technical resources.
This is where Machine Learning models can automate part of the analysis.
How Machine Learning helps detect anomalies in wind data
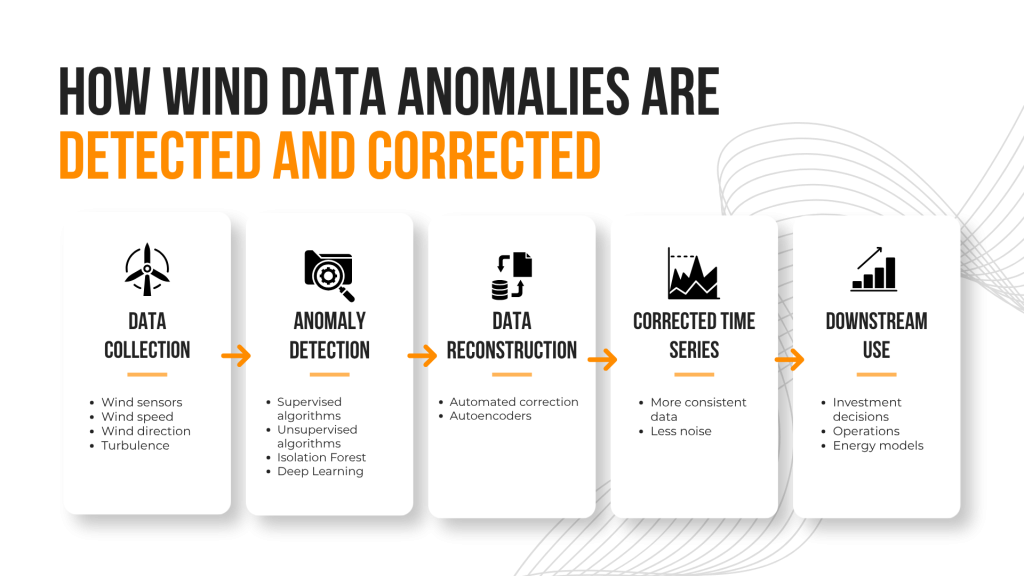
In one of Baobab AI’s projects involving wind data, a solution based on artificial intelligence and Machine Learning techniques was developed to automatically detect anomalies in time series. The approach combines supervised and unsupervised algorithms, including techniques such as Isolation Forest and Deep Learning models.
Supervised models can learn to recognize certain behaviors when previously classified examples are available. Unsupervised algorithms address a different situation: identifying observations that deviate from normal behavior without requiring every possible type of anomaly to have been labeled in advance.
This combination is particularly useful when working with series in which different types of anomalous behavior may appear. Rather than relying exclusively on manual review or rigid rules, the model analyzes patterns within the data and helps identify records that require treatment.
The value of this approach is directly linked to the decision that follows. Detecting an anomaly helps prevent incorrect information from continuing to be used as though it represented the actual behavior of the resource.
Detecting anomalous data does not solve the entire problem
Once an anomalous observation has been identified, a second need arises: correcting it without compromising the integrity of the time series.
Removing every suspicious value can create gaps in the historical record that make subsequent analyses more difficult. For this reason, the project developed by Baobab AI also includes the automated correction of detected anomalous values.
The techniques used include autoencoders, neural networks that learn to compress and reconstruct data. When an observation behaves differently from the patterns learned by the model, the reconstruction may show a larger error, helping to flag a potential anomaly.
This mechanism makes it possible to use reconstruction as part of the analysis process itself. The goal is to preserve the integrity of the series and improve the quality of the information later used by other analyses or energy models.
Reconstruction should not be understood as simply filling in missing values. It forms part of a process designed to detect and correct anomalous information in order to provide a more suitable data foundation for subsequent decisions.
How to extend the analysis across different locations
When an organization operates across multiple sites, the ability to reuse a model becomes important. If every new location requires starting the process from scratch, the effort needed to scale the solution increases considerably.
The Baobab AI case includes a geographic generalization component. Trained models can be exported and reused directly in other locations without the need for recalibration, making it possible to apply the approach across multiple sites with limited intervention.
This capability makes it easier to extend the analysis when a company needs to work with data from different locations. Scalability depends not only on processing more records, but also on reusing the knowledge already developed without having to rebuild the solution completely for every new site.
Would you like to learn more about how synthetic data is generated and the value it can bring to analytics and AI projects?
Discover on our blog how synthetic data generation works, its main applications, and why it can be especially valuable when real-world data is scarce, sensitive, or difficult to obtain.
What automated anomaly detection and correction delivers
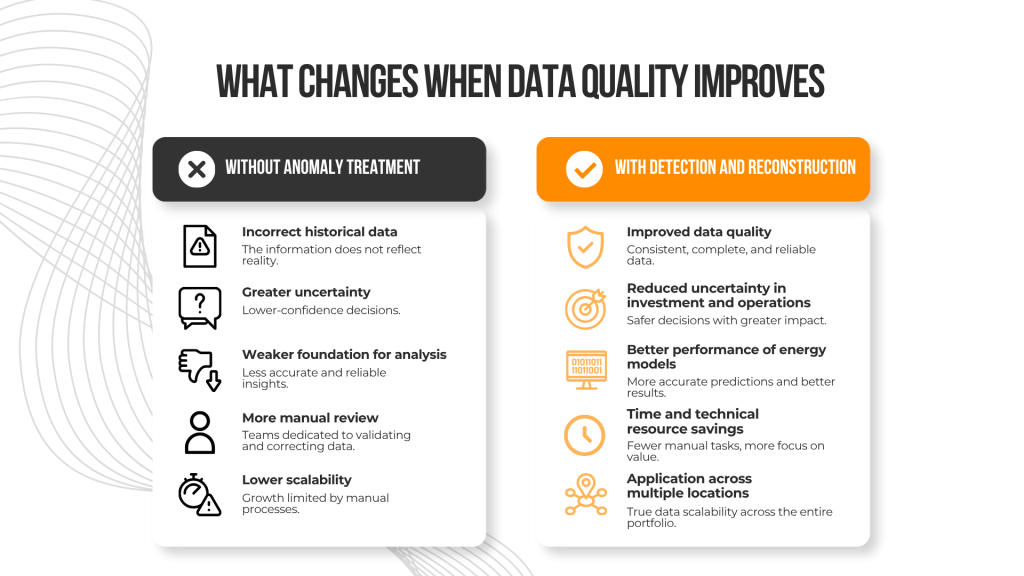
Automated anomaly detection and correction improves the quality of the information used in energy analyses and reduces the uncertainty associated with investment and operational decisions.
It also makes it possible to work with more reliable time series, improve the performance of energy models, and reduce the time and technical resources devoted to manual data review. In addition, reusing models across different locations facilitates deployment across multiple sites.
At Baobab AI, we apply Machine Learning and advanced analytics techniques to improve the quality of the data used in investment, sizing, and operational decisions in the energy sector.


